How much did mind-altering Substance Deaths increase in the in the U.S. in the recent five year span 2013-2017 compared to the prior 5 years?
The U.S. (United States) had a 35.5% mind-altering substance death increase in the last five year span, 2013-2017 vs 2008-2012 - - 123,368 more substance deaths in the last five year span 2013-2017 vs 2008-2012 = 471,222 - 347,854 = 123,368. 51 States had substance death increase.
Answer: the U.S. (United States) had a 35.5% mind-altering substance death increase, 2013-2017 vs 2008-2012
In the last 5 year span, 2013-2017, 471,222 people died from a mind-altering Substance death in the U.S. (see Substance Death ICD List below) - 64% of the deaths (300,692 deaths) occurred in 15 states: (California, Florida, Texas, Ohio, Pennsylvania, New York, Michigan, Illinois, North Carolina, Arizona, Massachusetts, New Jersey, Washington, Tennessee and Georgia).
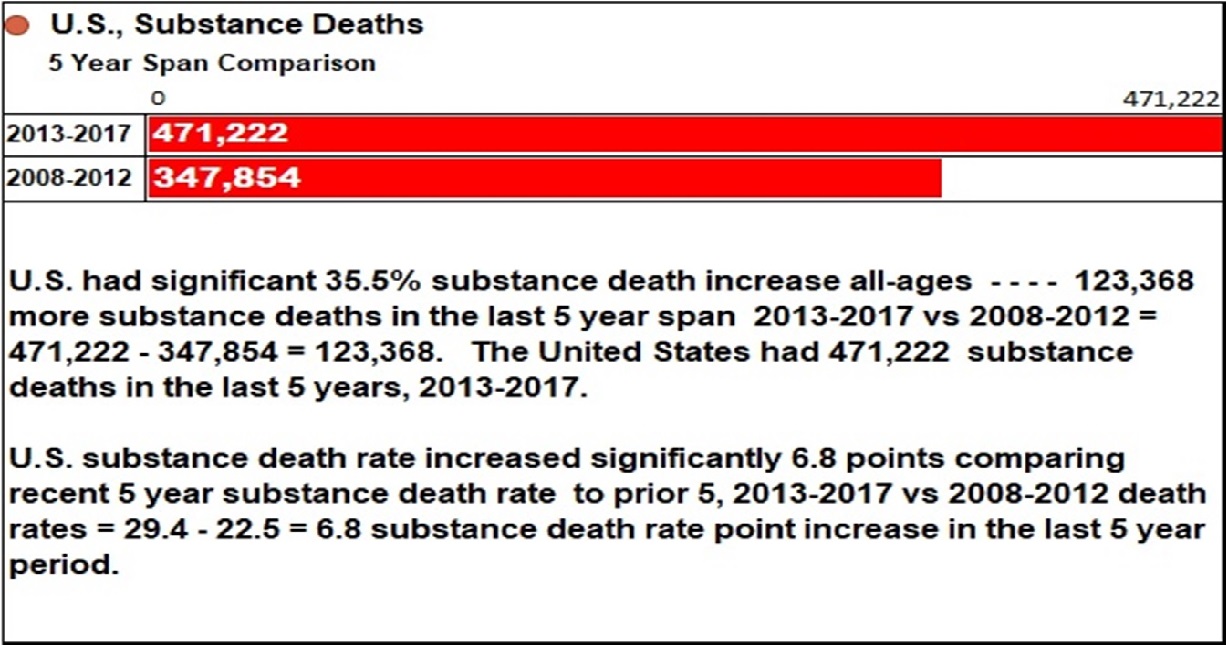
The U.S. had significant 35.5% substance death increase - - - 123,368 more substance deaths in the last five year span, 2013-2017 vs 2008-2012 = 471,222 - 347,854 = 123,368. The United States had 471,222 substance deaths in the last 5 years, 2013-2017.
U.S. substance death rate increased significantly 6.8 points comparing recent 5 year substance death rate to prior 5, 2013-2017 vs 2008-2012 death rates = 29.4 - 22.5 = 6.8 substance death rate point increase in the last 5 year period.
Calculation for Percent Change = ((New Value - Old Value)/ Old Value )*100 = 35.5% = U.S. ((2013-2017 Substance deaths - 2008-2012 Substance deaths ) / (2008-2012 Substance deaths ))*100 = ((471,222 - 347,854)/(347,854))*100 = (123,368/347,854)*100 = 35.5%
U.S., Substance Deaths 2013-2017 = 471,222, 5 Year Span
U.S., Substance Deaths 2013-2017 = 471,222, 5 Year Span
- 21.3% of Substance deaths are between ages 15-34 years old, (100,498 age 15-34 yr old substance deaths, in the 5 year span, 2013-2017)
- 64.9% of Substance deaths are between ages 0-54 years old, (305,826 of substance deaths are are under age 54 years old, in the 5 year span, 2013-2017)

U.S. lost young persons age 15-34 years old to a substance death at the rate of 55 substance deaths per day during 2013-2017 = 100,498 substance deaths / 5 years = 20,099.6 deaths per year / 365 days per year = 55 substance deaths per day during years 2013-2017.
U.S. lost residents to a substance death at the rate of 258 substance deaths per day during 2013-2017 = 471,222 substance deaths / 5 years = 94,244.4 deaths per year / 365 days per year = 258 substance deaths per day during years 2013-2017.
U.S. lost residents to a substance death at the rate of 258 substance deaths per day during 2013-2017 = 471,222 substance deaths / 5 years = 94,244.4 deaths per year / 365 days per year = 258 substance deaths per day during years 2013-2017.

Which age group had the largest increase in substance deaths in the recent five year span 2013-2017 compared to the prior five years?
Answer: The ten-year age group, ages 25-34 years old, had a 64.7% increase in substance deaths, the largest increase in substance death in the last five year span, 2013-2017 versus the five years prior 2008-2012.
U.S. young adults ages 25-34 years old had a 64.7% substance death increase - - - - 29,610 more substance deaths in the last 5 Year Span vs prior 5 years, 2013-2017 vs 2008-2012 = 75,350 - 45,740 = 29,610 more substance deaths in the last 5 Year Span. U.S. Ages 25-34 years old had 75,350 substance deaths in the last 5 years, 2013-2017.
U.S young adults ages 25-34 years substance death rate increased 12. points comparing recent 5 year substance death rate to prior 5, 2013-2017 vs 2008-2012 death rates = 34.2 - 22.2 = 12. death rate point increase in the last 5 yr period.
Calculation for Percent Change = ((New Value - Old Value)/ Old Value )*100 = 64.7% =25-34 years ((2013-2017 Substance deaths - 2008-2012 Substance deaths ) / (2008-2012 Substance deaths ))*100 = ((75,350 - 45,740) / ( 45,740))*100 = ((29,610) / ( 45,740))*100 = 64.7%

Key U.S. State Findings comparing recent five year mind altering substance deaths 2013-2017 to prior five years 2008-2012, State alphabetical table

What three states have the highest mind-altering substance death rates in the recent five year period, 2013-2017?
States with the highest death rates need the most support. States that have high death rates, need critical investigation to find the counties where this is feeding into the situation, need to document what is causing this high death increase to develop strategies to support sobriety in counties and in schools to educate young, to support good health and prevent early death. (County reports will be out ASAP)
Answer: West Virginia, New Mexico and New Hampshire have the highest substance death rates 2013-2017.

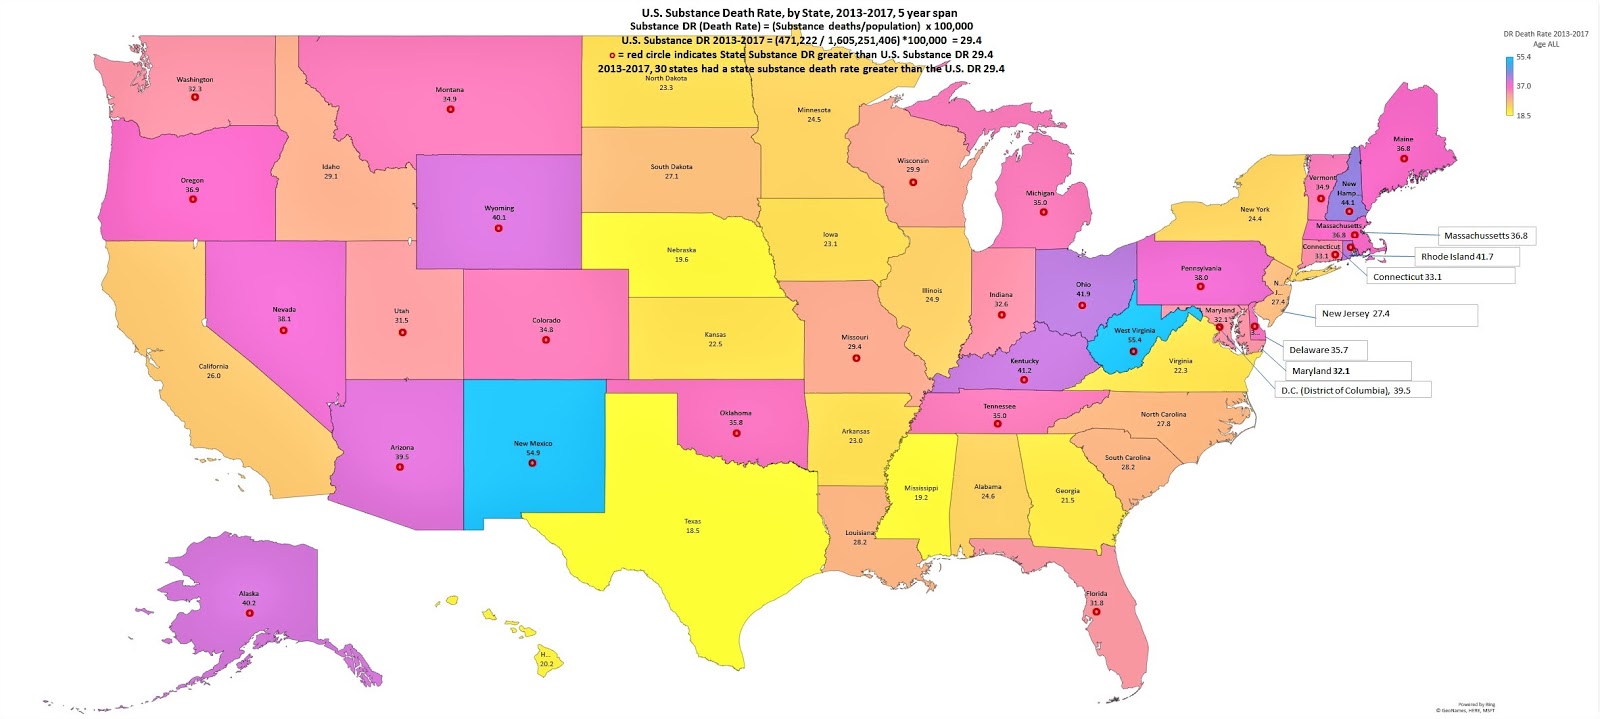
During 2013-2017, five year span, 30 states had a substance death rate greater than or equal to the U.S. '29.4', listed worst to best: West Virginia, New Mexico, New Hampshire, Ohio, Rhode Island, Kentucky, Alaska, Wyoming, Arizona, District of Columbia, Nevada, Pennsylvania, Oregon, Maine, Massachusetts, Oklahoma, Delaware, Tennessee, Michigan, Vermont, Montana, Colorado, Connecticut, Indiana, Washington, Maryland, Florida, Utah, Wisconsin, Missouri.
 the Red light indicates a state substance DR is higher "worse" than the U.S. substance DR '29.4'. States that are struggling with substance deaths have a higher DR than the U.S. DR.
The table below indicates the 471,222 U.S. Substance deaths, 2013-2017, 5 year span, sorted by state substance death rate.
Orange indicates the top 15 worst Substance death rates per state population. The red bars to the right indicate substance death volume.
DR (Death Rate) = (Substance Death Rate)/Population*100,000. U.S. Substance DR during 2013-2017 = (Deaths/Population)*100,000 = ((471,222) / (1,605,251,406)) * 100,000= 29.4. There were 29.4 Substance deaths per 100,000 persons in the U.S. during 2013-2017.
the Red light indicates a state substance DR is higher "worse" than the U.S. substance DR '29.4'. States that are struggling with substance deaths have a higher DR than the U.S. DR.
Population rank is broken into three categories:
HV = high volume 1-15 = HV
MV = medium volume 16-31 = MV
LV = low volume = 32+ = LV


What state had the highest substance death increase in the last five year span, 2013-2017, compared to the five years prior 2008-2012?
States that have high death increase, need critical support to investigate to find the counties where this is feeding into the situation, document what is causing this high death increase and develop good sober-minded strategies to support counties and schools to educate young support good health and prevent early death. (County reports will be out ASAP)
Answer: Connecticut had a 85.1% substance death increase, the highest state substance death increase 2013-2017. Connecticut had significant a 85.1% substance death increase - - - - 2,731 more substance deaths in the last 5 year span vs prior 5 years, 2013-2017 vs 2008-2012 = 5,941 - 3,210 = 2,731 more substance deaths in the last 5 year span.
Connecticut had 5,941 substance deaths in the last 5 years, 2013-2017. Connecticut substance death rate increased significantly 15.1 points comparing recent 5 year substance death rate to prior 5, 2013-2017 vs 2008-2012 death rates = 33.1 - 18. = 15.1 death rate point increase in the last 5 year period.
Calculation for Percent Change (substance death increase) = ((New Value - Old Value)/ Old Value )*100 = 85.1% = Connecticut ((2013-2017 substance deaths - 2008-2012 substance deaths ) / (2008-2012 substance deaths ))*100 = ((5,941 - 3,210) / ( 3,210))*100 = ((2,731) / ( 3,210))*100 = 85.1%
Calculation for Percent Change (substance death increase) = ((New Value - Old Value)/ Old Value )*100 = 85.1% = Connecticut ((2013-2017 substance deaths - 2008-2012 substance deaths ) / (2008-2012 substance deaths ))*100 = ((5,941 - 3,210) / ( 3,210))*100 = ((2,731) / ( 3,210))*100 = 85.1%

The table below indicates the 471,222 Substance U.S. deaths, 2013-2017, 5 year span compared to 5 years prior 2008-2012, sorted by state substance death percent change (substance death increase/decrease). Calculation for Percent Change = ((New Value - Old Value)/ Old Value )*100 = ((2013-2017 Substance deaths - 2008-2012 Substance deaths ) / (2008-2012 Substance deaths ))*100
Dark Red Highlight indicates state death increase in the table below. States that have high death increase, need critical support to investigate counties where this is happening, to understand what is causing this high death increase to develop strategies to support good health and prevent early death. (County reports will be out ASAP)


Michigan had significant a 31.4% substance death increase - - 4,145 more substance deaths in the last 5 year span versus prior five years, 2013-2017 vs 2008-2012 = 17,349 - 13,204 = 4,145 more substance deaths in the last 5 year span. Michigan had 17,349 substance deaths in the last 5 years, 2013-2017.
Michigan substance death rate increased significantly 8.3 points comparing recent 5 year substance death rate to prior 5, 2013-2017 vs 2008-2012 death rates = 35. - 26.7 = 8.3 death rate point increase in the last 5 yr period."
Calculation for Percent Change = ((New Value - Old Value)/ Old Value )*100 = 31.4% = Michigan ((2013-2017 Substance deaths - 2008-2012 Substance deaths ) / (2008-2012 Substance deaths ))*100 = ((17,349 - 13,204) / ( 13,204))*100 = ((4,145) / ( 13,204))*100 = 31.4%

Colorado had significant a 20.5% substance death increase - - - - 1,613 more substance deaths in the last 5 year span vs prior 5 years, 2013-2017 vs 2008-2012 = 9,466 - 7,853 = 1,613 more substance deaths in the last 5 year span. Colorado had 9,466 substance deaths in the last 5 years, 2013-2017.
Colorado substance death rate increased 3.6 points comparing recent 5 year substance death rate to prior 5, 2013-2017 vs 2008-2012 death rates = 34.8 - 31.2 = 3.6 death rate point increase in the last 5 yr period.
Calculation for Percent Change = ((New Value - Old Value)/ Old Value )*100 = 20.5% = Colorado ((2013-2017 Substance deaths - 2008-2012 Substance deaths ) / (2008-2012 Substance deaths ))*100 = ((9,466 - 7,853) / ( 7,853))*100 = ((1,613) / ( 7,853))*100 = 20.5%

Ohio had significant a 72.4% substance death increase - - - - 10,217 more substance deaths in the last 5 year span vs prior 5 years, 2013-2017 vs 2008-2012 = 24,328 - 14,111 = 10,217 more substance deaths in the last 5 year span. Ohio had 24,328 substance deaths in the last 5 years, 2013-2017.
Ohio substance death rate increased significantly 17.4 points comparing recent 5 year substance death rate to prior 5, 2013-2017 vs 2008-2012 death rates = 41.9 - 24.5 = 17.4 death rate point increase in the last 5 yr period.
Calculation for Percent Change = ((New Value - Old Value)/ Old Value )*100 = 72.4% = Ohio ((2013-2017 Substance deaths - 2008-2012 Substance deaths ) / (2008-2012 Substance deaths ))*100 = ((24,328 - 14,111) / ( 14,111))*100 = (10,217) / ( 14,111))*100 = 72.4%!!!!

Arizona had a 31.4% substance death increase - - - - 3,221 more substance deaths in the last 5 year span vs prior 5 years, 2013-2017 vs 2008-2012 = 13,490 - 10,269 = 3,221 more substance deaths in the last 5 year span. Arizona had 13,490 substance deaths in the last 5 years, 2013-2017.
Arizona substance death rate increased 7.5 points comparing recent 5 year substance death rate to prior 5, 2013-2017 vs 2008-2012 death rates = 39.5 - 32. = 7.5 death rate point increase in the last 5 yr period.
Calculation for Percent Change = ((New Value - Old Value)/ Old Value )*100 = 31.4% = Arizona ((2013-2017 Substance deaths - 2008-2012 Substance deaths ) / (2008-2012 Substance deaths ))*100 = ((13,490 - 10,269) / ( 10,269))*100 = ((3,221) / ( 10,269))*100 = 31.4%

Washington had a 18.68% substance death increase - - - - 1,825 more substance deaths in the last 5 year span vs prior 5 years, 2013-2017 vs 2008-2012 = 11,595 - 9,770 = 1,825 more substance deaths in the last 5 year span. Washington had 11,595 substance deaths in the last 5 years, 2013-2017.
Washington substance death rate increased 3.3 points comparing recent 5 year substance death rate to prior 5, 2013-2017 vs 2008-2012 death rates = 32.3 - 29. = 3.3 death rate point increase in the last 5 yr period.
Calculation for Percent Change = ((New Value - Old Value)/ Old Value )*100 = 18.7% = Washington ((2013-2017 Substance deaths - 2008-2012 Substance deaths ) / (2008-2012 Substance deaths ))*100 = ((11,595 - 9,770) / ( 9,770))*100 = ((1,825) / ( 9,770))*100 = 18.7%

Alabama had a 27.6% substance death increase - - - - 1,290 more substance deaths in the last 5 year span vs prior 5 years, 2013-2017 vs 2008-2012 = 5,962 - 4,672 = 1,290 more substance deaths in the last 5 year span. Alabama had 5,962 substance deaths in the last 5 years, 2013-2017.
Alabama substance death rate increased 5. points comparing recent 5 year substance death rate to prior 5, 2013-2017 vs 2008-2012 death rates = 24.6 - 19.6 = 5. death rate point increase in the last 5 yr period."
Calculation for Percent Change = ((New Value - Old Value)/ Old Value )*100 = 27.6% = Alabama ((2013-2017 Substance deaths - 2008-2012 Substance deaths ) / (2008-2012 Substance deaths ))*100 = ((5,962 - 4,672) / ( 4,672))*100 = ((1,290) / ( 4,672))*100 = 27.6%

Alaska had a 12.9% substance death increase - - - - 170 more substance deaths in the last 5 year span vs prior 5 years, 2013-2017 vs 2008-2012 = 1,484 - 1,314 = 170 more substance deaths in the last 5 year span. Alaska had 1,484 substance deaths in the last 5 years, 2013-2017.
Alaska substance death rate increased 3.2 points comparing recent 5 year substance death rate to prior 5, 2013-2017 vs 2008-2012 death rates = 40.2 - 37. = 3.2 death rate point increase in the last 5 yr period."
Calculation for Percent Change = ((New Value - Old Value)/ Old Value )*100 = 12.9% = Alaska ((2013-2017 Substance deaths - 2008-2012 Substance deaths ) / (2008-2012 Substance deaths ))*100 = ((1,484 - 1,314) / ( 1,314))*100 = ((170) / ( 1,314))*100 = 12.9%

Arkansas had significant a 13.8% substance death increase - - - - 415 more substance deaths in the last 5 year span vs prior 5 years, 2013-2017 vs 2008-2012 = 3,424 - 3,009 = 415 more substance deaths in the last 5 year span. Arkansas had 3,424 substance deaths in the last 5 years, 2013-2017.
Arkansas substance death rate increased 2.3 points comparing recent 5 year substance death rate to prior 5, 2013-2017 vs 2008-2012 death rates = 23. - 20.6 = 2.3 death rate point increase in the last 5 yr period.
Calculation for Percent Change = ((New Value - Old Value)/ Old Value )*100 = 13.8% = Arkansas ((2013-2017 Substance deaths - 2008-2012 Substance deaths ) / (2008-2012 Substance deaths ))*100 = ((3,424 - 3,009) / ( 3,009))*100 = ((415) / ( 3,009))*100 = 13.8%

California had significant a 15.1% substance death increase - - - - 6,657 more substance deaths in the last 5 year span vs prior 5 years, 2013-2017 vs 2008-2012 = 50,751 - 44,094 = 6,657 more substance deaths in the last 5 year span. California had 50,751 substance deaths in the last 5 years, 2013-2017.
California substance death rate increased 2.4 points comparing recent 5 year substance death rate to prior 5, 2013-2017 vs 2008-2012 death rates = 26. - 23.6 = 2.4 death rate point increase in the last 5 yr period.
Calculation for Percent Change = ((New Value - Old Value)/ Old Value )*100 = 15.1% = California ((2013-2017 Substance deaths - 2008-2012 Substance deaths ) / (2008-2012 Substance deaths ))*100 = ((50,751 - 44,094) / ( 44,094))*100 = ((6,657) / ( 44,094))*100 = 15.1%

Connecticut had significant a 85.1% substance death increase - - - - 2,731 more substance deaths in the last 5 year span vs prior 5 years, 2013-2017 vs 2008-2012 = 5,941 - 3,210 = 2,731 more substance deaths in the last 5 year span. Connecticut had 5,941 substance deaths in the last 5 years, 2013-2017.
Connecticut substance death rate increased significantly 15.1 points comparing recent 5 year substance death rate to prior 5, 2013-2017 vs 2008-2012 death rates = 33.1 - 18. = 15.1 death rate point increase in the last 5 yr period."
Calculation for Percent Change = ((New Value - Old Value)/ Old Value )*100 = 85.1% = Connecticut ((2013-2017 Substance deaths - 2008-2012 substance deaths ) / (2008-2012 substance deaths ))*100 = ((5,941 - 3,210) / ( 3,210))*100 = ((2,731) / ( 3,210))*100 = 85.1%

Alabama had significant a 27.6% substance death increase - - -
- 1,290 more substance deaths in
the recent 5 year span versus prior 5 years, 2013-2017 versus 2008-2012 = 5,962
- 4,672 = 1,290 more substance deaths in the recent 5 year span. Alabama
had 5,962 substance deaths in the recent 5 years, 2013-2017.
Alabama substance death rate
increased significantly 5. points comparing
recent 5 year substance death rate to prior 5, 2013-2017 versus 2008-2012
death rates = 24.6 - 19.6 = 5. death rate point increase in the recent 5 year
period. Substance Death Rate = (Substance deaths/population) x 100,000.
Calculation for Percent Change = ((New Value - Old Value)/ Old Value )*100 = 27.6% =
Alabama ((2013-2017 Substance deaths - 2008-2012 Substance deaths ) /
(2008-2012 Substance deaths ))*100 = ((5,962 - 4,672) / ( 4,672))*100 =
((1,290) / ( 4,672))*100 = 27.6%

Alaska had significant a 12.9% substance death increase - - - - 170 more substance deaths in the recent 5
year span versus prior 5 years, 2013-2017 versus 2008-2012 = 1,484 - 1,314 =
170 more substance deaths in the recent 5 year span. Alaska had 1,484
substance deaths in the recent 5 years, 2013-2017.
Alaska substance death rate
increased significantly 3.2 points comparing
recent 5 year substance death rate to prior 5, 2013-2017 versus 2008-2012
death rates = 40.2 - 37. = 3.2 death rate point increase in the recent 5 year
period. Substance Death Rate = (Substance deaths/population) x 100,000.
Calculation for Percent Change = ((New Value - Old Value)/ Old Value )*100 = 12.9% =
Alaska ((2013-2017 Substance deaths - 2008-2012 Substance deaths ) / (2008-2012
Substance deaths ))*100 = ((1,484 - 1,314) / ( 1,314))*100 = ((170)
/ ( 1,314))*100 =
12.9%

Arizona had significant a 31.4% substance death
increase - - - -
3,221 more substance deaths in the recent 5 year span versus prior 5 years,
2013-2017 versus 2008-2012 = 13,490 - 10,269 = 3,221 more substance deaths in
the recent 5 year span. Arizona had 13,490 substance deaths in the recent
5 years, 2013-2017.
Arizona substance death rate
increased significantly 7.5 points comparing
recent 5 year substance death rate to prior 5, 2013-2017 versus 2008-2012
death rates = 39.5 - 32. = 7.5 death rate point increase in the recent 5 year
period. Substance Death Rate = (Substance deaths/population) x 100,000.
Calculation for Percent Change = ((New Value - Old Value)/ Old Value )*100 = 31.4% =
Arizona ((2013-2017 Substance deaths - 2008-2012 Substance deaths ) /
(2008-2012 Substance deaths ))*100 = ((13,490 - 10,269) / ( 10,269))*100
= ((3,221) / ( 10,269))*100 =
31.4%

Arkansas had significant a 13.8% substance death
increase - - -
- 415 more substance deaths in
the recent 5 year span versus prior 5 years, 2013-2017 versus 2008-2012 = 3,424
- 3,009 = 415 more substance deaths in the recent 5 year span. Arkansas
had 3,424 substance deaths in the recent 5 years, 2013-2017.
Arkansas substance death rate
increased 2.3 points comparing
recent 5 year substance death rate to prior 5, 2013-2017 versus 2008-2012
death rates = 23. - 20.6 = 2.3 death rate point increase in the recent 5 year
period. Substance Death Rate = (Substance deaths/population) x
100,000.
Calculation for Percent Change = ((New Value - Old Value)/ Old Value )*100 = 13.8% =
Arkansas ((2013-2017 Substance deaths - 2008-2012 Substance deaths ) /
(2008-2012 Substance deaths ))*100 = ((3,424 - 3,009) / ( 3,009))*100 =
((415) / ( 3,009))*100 =
13.8%

California had significant a 15.1% substance death
increase - - -
- 6,657 more substance deaths in
the recent 5 year span versus prior 5 years, 2013-2017 versus 2008-2012 =
50,751 - 44,094 = 6,657 more substance deaths in the recent 5 year span.
California had 50,751 substance deaths in the recent 5 years, 2013-2017.
California substance death rate
increased 2.4 points comparing
recent 5 year substance death rate to prior 5, 2013-2017 versus 2008-2012
death rates = 26. - 23.6 = 2.4 death rate point increase in the recent 5 year
period. Substance Death Rate = (Substance deaths/population) x
100,000.
Calculation for Percent Change = ((New Value - Old Value)/ Old Value )*100 = 15.1% =
California ((2013-2017 Substance deaths - 2008-2012 Substance deaths ) /
(2008-2012 Substance deaths ))*100 = ((50,751 - 44,094) / ( 44,094))*100
= ((6,657) / ( 44,094))*100 =
15.1%

Connecticut had significant a 85.1% substance death
increase - - -
- 2,731 more substance deaths in
the recent 5 year span versus prior 5 years, 2013-2017 versus 2008-2012 = 5,941
- 3,210 = 2,731 more substance deaths in the recent 5 year span.
Connecticut had 5,941 substance deaths in the recent 5 years, 2013-2017.
Connecticut substance death rate
increased significantly 15.1 points comparing recent 5 year substance death rate to
prior 5, 2013-2017 versus 2008-2012 death rates = 33.1 - 18. = 15.1 death rate
point increase in the recent 5 year period. Substance Death Rate =
(Substance deaths/population) x
100,000.
Calculation for Percent Change = ((New Value - Old Value)/ Old Value )*100 = 85.1% =
Connecticut ((2013-2017 Substance deaths - 2008-2012 Substance deaths ) /
(2008-2012 Substance deaths ))*100 = ((5,941 - 3,210) / ( 3,210))*100 =
((2,731) / ( 3,210))*100 =
85.1%

Delaware had significant a 50.1% substance death
increase - - -
- 563 more substance deaths in
the recent 5 year span versus prior 5 years, 2013-2017 versus 2008-2012 = 1,686
- 1,123 = 563 more substance deaths in the recent 5 year span. Delaware
had 1,686 substance deaths in the recent 5 years, 2013-2017.
Delaware substance death rate
increased significantly 10.7 points comparing recent 5 year substance death rate to
prior 5, 2013-2017 versus 2008-2012 death rates = 35.7 - 25. = 10.7 death rate
point increase in the recent 5 year period. Substance Death Rate =
(Substance deaths/population) x
100,000.
Calculation for Percent Change = ((New Value - Old Value)/ Old Value )*100 = 50.1% =
Delaware ((2013-2017 Substance deaths - 2008-2012 Substance deaths ) /
(2008-2012 Substance deaths ))*100 = ((1,686 - 1,123) / ( 1,123))*100 =
((563) / ( 1,123))*100 =
50.1%

District of Columbia had significant a 68.8% substance death
increase - - -
- 539 more substance deaths in
the recent 5 year span versus prior 5 years, 2013-2017 versus 2008-2012 = 1,323
- 784 = 539 more substance deaths in the recent 5 year span. District of
Columbia had 1,323 substance deaths in the recent 5 years, 2013-2017.
District of Columbia substance death
rate increased significantly 13.5 points comparing recent 5 year substance death rate to
prior 5, 2013-2017 versus 2008-2012 death rates = 39.5 - 25.9 = 13.5 death rate
point increase in the recent 5 year period. Substance Death Rate =
(Substance deaths/population) x
100,000.
Calculation for Percent Change = ((New Value - Old Value)/ Old Value )*100 = 68.8% =
District of Columbia ((2013-2017 Substance deaths - 2008-2012 Substance deaths
) / (2008-2012 Substance deaths ))*100 = ((1,323 - 784) / ( 784))*100 =
((539) / ( 784))*100 =
68.8%

Florida had significant a 28.% substance death increase - - - - 7,053 more substance deaths in the recent
5 year span versus prior 5 years, 2013-2017 versus 2008-2012 = 32,206 - 25,153
= 7,053 more substance deaths in the recent 5 year span. Florida had
32,206 substance deaths in the recent 5 years, 2013-2017.
Florida substance death rate
increased significantly 5.1 points comparing recent 5 year substance death rate to
prior 5, 2013-2017 versus 2008-2012 death rates = 31.8 - 26.7 = 5.1 death rate
point increase in the recent 5 year period. Substance Death Rate =
(Substance deaths/population) x 100,000.
Calculation for Percent Change = ((New Value - Old Value)/ Old Value )*100 = 28.% =
Florida ((2013-2017 Substance deaths - 2008-2012 Substance deaths ) /
(2008-2012 Substance deaths ))*100 = ((32,206 - 25,153) / ( 25,153))*100
= ((7,053) / ( 25,153))*100 =
28.%

Georgia had significant a 27.7% substance death
increase - - -
- 2,376 more substance deaths in
the recent 5 year span versus prior 5 years, 2013-2017 versus 2008-2012 =
10,964 - 8,588 = 2,376 more substance deaths in the recent 5 year span.
Georgia had 10,964 substance deaths in the recent 5 years, 2013-2017.
Georgia substance death rate
increased significantly 3.8 points comparing recent 5 year substance death rate to
prior 5, 2013-2017 versus 2008-2012 death rates = 21.5 - 17.7 = 3.8 death rate
point increase in the recent 5 year period. Substance Death Rate =
(Substance deaths/population) x 100,000.
Calculation for Percent Change = ((New Value - Old Value)/ Old Value )*100 = 27.7% =
Georgia ((2013-2017 Substance deaths - 2008-2012 Substance deaths ) /
(2008-2012 Substance deaths ))*100 = ((10,964 - 8,588) / ( 8,588))*100 =
((2,376) / ( 8,588))*100 =
27.7%

Hawaii had significant a 9.9% substance death increase - - - - 129 more substance deaths
in the recent 5 year span versus prior 5 years, 2013-2017 versus 2008-2012 =
1,437 - 1,308 = 129 more substance deaths in the recent 5 year span.
Hawaii had 1,437 substance deaths in the recent 5 years, 2013-2017.
Hawaii substance death rate
increased 1. points comparing recent 5 year substance death rate to
prior 5, 2013-2017 versus 2008-2012 death rates = 20.2 - 19.2 = 1. death rate
point increase in the recent 5 year period. Substance Death Rate =
(Substance deaths/population) x 100,000.
Calculation for Percent Change = ((New Value - Old Value)/ Old Value )*100 = 9.9% =
Hawaii ((2013-2017 Substance deaths - 2008-2012 Substance deaths ) / (2008-2012
Substance deaths ))*100 = ((1,437 - 1,308) / ( 1,308))*100 = ((129)
/ ( 1,308))*100 =
9.9%

Idaho had significant a 25.9% substance death increase - - - - 497 more substance deaths in the recent 5
year span versus prior 5 years, 2013-2017 versus 2008-2012 = 2,416 - 1,919 =
497 more substance deaths in the recent 5 year span. Idaho had 2,416
substance deaths in the recent 5 years, 2013-2017.
Idaho substance death rate increased
significantly 4.6 points comparing recent 5 year substance death rate to
prior 5, 2013-2017 versus 2008-2012 death rates = 29.1 - 24.5 = 4.6 death rate
point increase in the recent 5 year period. Substance Death Rate =
(Substance deaths/population) x 100,000.
Calculation for Percent Change = ((New Value - Old Value)/ Old Value )*100 = 25.9% =
Idaho ((2013-2017 Substance deaths - 2008-2012 Substance deaths ) / (2008-2012
Substance deaths ))*100 = ((2,416 - 1,919) / ( 1,919))*100 = ((497)
/ ( 1,919))*100 =
25.9%

Illinois had significant a 38.4% substance death increase - - - - 4,428 more substance deaths in the recent
5 year span versus prior 5 years, 2013-2017 versus 2008-2012 = 15,974 - 11,546
= 4,428 more substance deaths in the recent 5 year span. Illinois had
15,974 substance deaths in the recent 5 years, 2013-2017.
Illinois substance death rate increased
significantly 6.9 points comparing recent 5 year substance death rate to
prior 5, 2013-2017 versus 2008-2012 death rates = 24.9 - 18. = 6.9 death rate
point increase in the recent 5 year period. Substance Death Rate =
(Substance deaths/population) x 100,000.
Calculation for Percent Change = ((New Value - Old Value)/ Old Value )*100 = 38.4% =
Illinois ((2013-2017 Substance deaths - 2008-2012 Substance deaths ) /
(2008-2012 Substance deaths ))*100 = ((15,974 - 11,546) / ( 11,546))*100
= ((4,428) / ( 11,546))*100 =
38.4%

Indiana had significant a 45.6% substance death
increase - - -
- 3,383 more substance deaths in
the recent 5 year span versus prior 5 years, 2013-2017 versus 2008-2012 =
10,796 - 7,413 = 3,383 more substance deaths in the recent 5 year span.
Indiana had 10,796 substance deaths in the recent 5 years, 2013-2017.
Indiana substance death rate
increased significantly 9.8 points comparing recent 5 year substance death rate to
prior 5, 2013-2017 versus 2008-2012 death rates = 32.6 - 22.9 = 9.8 death rate
point increase in the recent 5 year period. Substance Death Rate =
(Substance deaths/population) x 100,000.
Calculation for Percent Change = ((New Value - Old Value)/ Old Value )*100 = 45.6% =
Indiana ((2013-2017 Substance deaths - 2008-2012 Substance deaths ) /
(2008-2012 Substance deaths ))*100 = ((10,796 - 7,413) / ( 7,413))*100 =
((3,383) / ( 7,413))*100 =
45.6%

Iowa had significant a 37.2% substance death increase - - - - 977 more substance deaths in the recent 5
year span versus prior 5 years, 2013-2017 versus 2008-2012 = 3,601 - 2,624 =
977 more substance deaths in the recent 5 year span. Iowa had 3,601
substance deaths in the recent 5 years, 2013-2017.
Iowa substance death rate increased
significantly 5.9 points comparing recent 5 year substance death rate to
prior 5, 2013-2017 versus 2008-2012 death rates = 23.1 - 17.2 = 5.9 death rate
point increase in the recent 5 year period. Substance Death Rate =
(Substance deaths/population) x 100,000.
Calculation for Percent Change = ((New Value - Old Value)/ Old Value )*100 = 37.2% =
Iowa ((2013-2017 Substance deaths - 2008-2012 Substance deaths ) / (2008-2012
Substance deaths ))*100 = ((3,601 - 2,624) / ( 2,624))*100 = ((977)
/ ( 2,624))*100 =
37.2%

Kansas had significant a 19.9% substance death increase - - - - 543 more substance deaths in the recent 5
year span versus prior 5 years, 2013-2017 versus 2008-2012 = 3,269 - 2,726 =
543 more substance deaths in the recent 5 year span. Kansas had 3,269
substance deaths in the recent 5 years, 2013-2017.
Kansas substance death rate
increased significantly 3.4 points comparing recent 5 year substance death rate to
prior 5, 2013-2017 versus 2008-2012 death rates = 22.5 - 19.1 = 3.4 death rate
point increase in the recent 5 year period. Substance Death Rate =
(Substance deaths/population) x 100,000.
Calculation for Percent Change = ((New Value - Old Value)/ Old Value )*100 = 19.9% =
Kansas ((2013-2017 Substance deaths - 2008-2012 Substance deaths ) / (2008-2012
Substance deaths ))*100 = ((3,269 - 2,726) / ( 2,726))*100 = ((543)
/ ( 2,726))*100 =
19.9%

Kentucky had significant a 36.3% substance death
increase - - -
- 2,429 more substance deaths in
the recent 5 year span versus prior 5 years, 2013-2017 versus 2008-2012 = 9,116
- 6,687 = 2,429 more substance deaths in the recent 5 year span. Kentucky
had 9,116 substance deaths in the recent 5 years, 2013-2017.
Kentucky substance death rate
increased significantly 10.4 points comparing recent 5 year substance death rate to
prior 5, 2013-2017 versus 2008-2012 death rates = 41.2 - 30.8 = 10.4 death rate
point increase in the recent 5 year period. Substance Death Rate =
(Substance deaths/population) x 100,000.
Calculation for Percent Change = ((New Value - Old Value)/ Old Value )*100 = 36.3% =
Kentucky ((2013-2017 Substance deaths - 2008-2012 Substance deaths ) /
(2008-2012 Substance deaths ))*100 = ((9,116 - 6,687) / ( 6,687))*100 =
((2,429) / ( 6,687))*100 =
36.3%

Louisiana had significant a 51.4% substance death
increase - - -
- 2,234 more substance deaths in
the recent 5 year span versus prior 5 years, 2013-2017 versus 2008-2012 = 6,580
- 4,346 = 2,234 more substance deaths in the recent 5 year span.
Louisiana had 6,580 substance deaths in the recent 5 years, 2013-2017.
Louisiana substance death rate increased
significantly 9. points comparing recent 5 year substance death rate to
prior 5, 2013-2017 versus 2008-2012 death rates = 28.2 - 19.2 = 9. death rate
point increase in the recent 5 year period. Substance Death Rate = (Substance
deaths/population) x
100,000.
Calculation for Percent Change = ((New Value - Old Value)/ Old Value )*100 = 51.4% =
Louisiana ((2013-2017 Substance deaths - 2008-2012 Substance deaths ) /
(2008-2012 Substance deaths ))*100 = ((6,580 - 4,346) / ( 4,346))*100 =
((2,234) / ( 4,346))*100 =
51.4%

Maine had significant a 63.9% substance death increase - - - - 955 more substance deaths in the recent 5
year span versus prior 5 years, 2013-2017 versus 2008-2012 = 2,449 - 1,494 =
955 more substance deaths in the recent 5 year span. Maine had 2,449
substance deaths in the recent 5 years, 2013-2017.
Maine substance death rate increased
significantly 14.3 points comparing recent 5 year substance death rate to
prior 5, 2013-2017 versus 2008-2012 death rates = 36.8 - 22.5 = 14.3 death rate
point increase in the recent 5 year period. Substance Death Rate =
(Substance deaths/population) x 100,000.
Calculation for Percent Change = ((New Value - Old Value)/ Old Value )*100 = 63.9% =
Maine ((2013-2017 Substance deaths - 2008-2012 Substance deaths ) / (2008-2012
Substance deaths ))*100 = ((2,449 - 1,494) / ( 1,494))*100 = ((955)
/ ( 1,494))*100 =
63.9%

Maryland had significant a 78.5% substance death
increase - - -
- 4,229 more substance deaths in
the recent 5 year span versus prior 5 years, 2013-2017 versus 2008-2012 = 9,615
- 5,386 = 4,229 more substance deaths in the recent 5 year span. Maryland
had 9,615 substance deaths in the recent 5 years, 2013-2017.
Maryland substance death rate
increased significantly 13.4 points comparing recent 5 year substance death rate to
prior 5, 2013-2017 versus 2008-2012 death rates = 32.1 - 18.6 = 13.4 death rate
point increase in the recent 5 year period. Substance Death Rate =
(Substance deaths/population) x
100,000.
Calculation for Percent Change = ((New Value - Old Value)/ Old Value )*100 = 78.5% =
Maryland ((2013-2017 Substance deaths - 2008-2012 Substance deaths ) /
(2008-2012 Substance deaths ))*100 = ((9,615 - 5,386) / ( 5,386))*100 =
((4,229) / ( 5,386))*100 =
78.5%

Massachusetts had significant a 73.2% substance death
increase - - -
- 5,267 more substance deaths in
the recent 5 year span versus prior 5 years, 2013-2017 versus 2008-2012 = 12,462
- 7,195 = 5,267 more substance deaths in the recent 5 year span.
Massachusetts had 12,462 substance deaths in the recent 5 years, 2013-2017.
Massachusetts substance death rate
increased significantly 14.8 points comparing recent 5 year substance death rate to
prior 5, 2013-2017 versus 2008-2012 death rates = 36.8 - 22. = 14.8 death rate
point increase in the recent 5 year period. Substance Death Rate =
(Substance deaths/population) x
100,000.
Calculation for Percent Change = ((New Value - Old Value)/ Old Value )*100 = 73.2% =
Massachusetts ((2013-2017 Substance deaths - 2008-2012 Substance deaths ) /
(2008-2012 Substance deaths ))*100 = ((12,462 - 7,195) / ( 7,195))*100 =
((5,267) / ( 7,195))*100 =
73.2%

Minnesota had significant a 37.6% substance death
increase - - -
- 1,838 more substance deaths in
the recent 5 year span versus prior 5 years, 2013-2017 versus 2008-2012 = 6,720
- 4,882 = 1,838 more substance deaths in the recent 5 year span.
Minnesota had 6,720 substance deaths in the recent 5 years, 2013-2017.
Minnesota substance death rate
increased significantly 6.1 points comparing recent 5 year substance death rate to
prior 5, 2013-2017 versus 2008-2012 death rates = 24.5 - 18.4 = 6.1 death rate
point increase in the recent 5 year period. Substance Death Rate =
(Substance deaths/population) x
100,000.
Calculation for Percent Change = ((New Value - Old Value)/ Old Value )*100 = 37.6% =
Minnesota ((2013-2017 Substance deaths - 2008-2012 Substance deaths ) /
(2008-2012 Substance deaths ))*100 = ((6,720 - 4,882) / ( 4,882))*100 =
((1,838) / ( 4,882))*100 =
37.6%

Mississippi had significant a 9.8% substance death
increase - - -
- 257 more substance deaths in
the recent 5 year span versus prior 5 years, 2013-2017 versus 2008-2012 = 2,875
- 2,618 = 257 more substance deaths in the recent 5 year span.
Mississippi had 2,875 substance deaths in the recent 5 years, 2013-2017.
Mississippi substance death rate increased 1.6 points comparing
recent 5 year substance death rate to prior 5, 2013-2017 versus 2008-2012
death rates = 19.2 - 17.6 = 1.6 death rate point increase in the recent 5 year
period. Substance Death Rate = (Substance deaths/population) x 100,000.
Calculation for Percent Change = ((New Value - Old Value)/ Old Value )*100 = 9.8% =
Mississippi ((2013-2017 Substance deaths - 2008-2012 Substance deaths ) /
(2008-2012 Substance deaths ))*100 = ((2,875 - 2,618) / ( 2,618))*100 =
((257) / ( 2,618))*100 =
9.8%

Missouri had significant a 29.1% substance death
increase - - -
- 2,017 more substance deaths in
the recent 5 year span versus prior 5 years, 2013-2017 versus 2008-2012 = 8,943
- 6,926 = 2,017 more substance deaths in the recent 5 year span. Missouri
had 8,943 substance deaths in the recent 5 years, 2013-2017.
Missouri substance death rate
increased significantly 6.3 points comparing recent 5 year substance death rate to
prior 5, 2013-2017 versus 2008-2012 death rates = 29.4 - 23.2 = 6.3 death rate
point increase in the recent 5 year period. Substance Death Rate =
(Substance deaths/population) x
100,000.
Calculation for Percent Change = ((New Value - Old Value)/ Old Value )*100 = 29.1% =
Missouri ((2013-2017 Substance deaths - 2008-2012 Substance deaths ) /
(2008-2012 Substance deaths ))*100 = ((8,943 - 6,926) / ( 6,926))*100 =
((2,017) / ( 6,926))*100 = 29.1%

Montana had significant a 18.5% substance death
increase - - -
- 281 more substance deaths in
the recent 5 year span versus prior 5 years, 2013-2017 versus 2008-2012 = 1,803
- 1,522 = 281 more substance deaths in the recent 5 year span. Montana
had 1,803 substance deaths in the recent 5 years, 2013-2017.
Montana substance death rate
increased significantly 4.2 points comparing recent 5 year substance death rate to
prior 5, 2013-2017 versus 2008-2012 death rates = 34.9 - 30.7 = 4.2 death rate
point increase in the recent 5 year period. Substance Death Rate =
(Substance deaths/population) x
100,000.
Calculation for Percent Change = ((New Value - Old Value)/ Old Value )*100 = 18.5% =
Montana ((2013-2017 Substance deaths - 2008-2012 Substance deaths ) / (2008-2012
Substance deaths ))*100 = ((1,803 - 1,522) / ( 1,522))*100 = ((281)
/ ( 1,522))*100 =
18.5%

Nebraska had significant a 25.% substance death
increase - - -
- 371 more substance deaths in
the recent 5 year span versus prior 5 years, 2013-2017 versus 2008-2012 = 1,857
- 1,486 = 371 more substance deaths in the recent 5 year span. Nebraska
had 1,857 substance deaths in the recent 5 years, 2013-2017.
Nebraska substance death rate
increased significantly 3.3 points comparing recent 5 year substance death rate to
prior 5, 2013-2017 versus 2008-2012 death rates = 19.6 - 16.3 = 3.3 death rate
point increase in the recent 5 year period. Substance Death Rate =
(Substance deaths/population) x
100,000.
Calculation for Percent Change = ((New Value - Old Value)/ Old Value )*100 = 25.% =
Nebraska ((2013-2017 Substance deaths - 2008-2012 Substance deaths ) /
(2008-2012 Substance deaths ))*100 = ((1,857 - 1,486) / ( 1,486))*100 =
((371) / ( 1,486))*100 = 25.%

Nevada had significant a 16.7% substance death increase - - - - 791 more substance deaths in the recent 5
year span versus prior 5 years, 2013-2017 versus 2008-2012 = 5,514 - 4,723 =
791 more substance deaths in the recent 5 year span. Nevada had 5,514
substance deaths in the recent 5 years, 2013-2017.
Nevada substance death rate
increased significantly 3.2 points comparing recent 5 year substance death rate to
prior 5, 2013-2017 versus 2008-2012 death rates = 38.1 - 34.9 = 3.2 death rate
point increase in the recent 5 year period. Substance Death Rate =
(Substance deaths/population) x 100,000.
Calculation for Percent Change = ((New Value - Old Value)/ Old Value )*100 = 16.7% =
Nevada ((2013-2017 Substance deaths - 2008-2012 Substance deaths ) / (2008-2012
Substance deaths ))*100 = ((5,514 - 4,723) / ( 4,723))*100 = ((791)
/ ( 4,723))*100 =
16.7%

New Hampshire had significant a 84.6% substance death
increase - - -
- 1,345 more substance deaths in
the recent 5 year span versus prior 5 years, 2013-2017 versus 2008-2012 = 2,935
- 1,590 = 1,345 more substance deaths in the recent 5 year span. New Hampshire
had 2,935 substance deaths in the recent 5 years, 2013-2017.
New Hampshire substance death rate
increased significantly 19.9 points comparing recent 5 year substance death rate to
prior 5, 2013-2017 versus 2008-2012 death rates = 44.1 - 24.1 = 19.9 death rate
point increase in the recent 5 year period. Substance Death Rate =
(Substance deaths/population) x
100,000.
Calculation for Percent Change = ((New Value - Old Value)/ Old Value )*100 = 84.6% =
New Hampshire ((2013-2017 Substance deaths - 2008-2012 Substance deaths ) / (2008-2012
Substance deaths ))*100 = ((2,935 - 1,590) / ( 1,590))*100 =
((1,345) / ( 1,590))*100 =
84.6%

New Jersey had significant a 70.4% substance death
increase - - -
- 5,073 more substance deaths in
the recent 5 year span versus prior 5 years, 2013-2017 versus 2008-2012 = 12,278
- 7,205 = 5,073 more substance deaths in the recent 5 year span. New
Jersey had 12,278 substance deaths in the recent 5 years, 2013-2017.
New Jersey substance death rate
increased significantly 11. points comparing recent 5 year substance death rate to
prior 5, 2013-2017 versus 2008-2012 death rates = 27.4 - 16.4 = 11. death rate
point increase in the recent 5 year period. Substance Death Rate =
(Substance deaths/population) x
100,000.
Calculation for Percent Change = ((New Value - Old Value)/ Old Value )*100 = 70.4% =
New Jersey ((2013-2017 Substance deaths - 2008-2012 Substance deaths ) /
(2008-2012 Substance deaths ))*100 = ((12,278 - 7,205) / ( 7,205))*100 =
((5,073) / ( 7,205))*100 =
70.4%

New Mexico had significant a 17.3% substance death
increase - - - - 844 more substance deaths in the recent 5
year span versus prior 5 years, 2013-2017 versus 2008-2012 = 5,728 - 4,884 =
844 more substance deaths in the recent 5 year span. New Mexico had 5,728
substance deaths in the recent 5 years, 2013-2017.
New Mexico substance death rate
increased significantly 7.4 points comparing recent 5 year substance death rate to
prior 5, 2013-2017 versus 2008-2012 death rates = 54.9 - 47.5 = 7.4 death rate
point increase in the recent 5 year period. Substance Death Rate = (Substance
deaths/population) x
100,000.
Calculation for Percent Change = ((New Value - Old Value)/ Old Value )*100 = 17.3% =
New Mexico ((2013-2017 Substance deaths - 2008-2012 Substance deaths ) /
(2008-2012 Substance deaths ))*100 = ((5,728 - 4,884) / ( 4,884))*100 =
((844) / ( 4,884))*100 =
17.3%

New York had significant a 43.6% substance death
increase - - -
- 7,330 more substance deaths in
the recent 5 year span versus prior 5 years, 2013-2017 versus 2008-2012 =
24,124 - 16,794 = 7,330 more substance deaths in the recent 5 year span.
New York had 24,124 substance deaths in the recent 5 years, 2013-2017.
New York substance death rate
increased significantly 7.1 points comparing recent 5 year substance death rate to
prior 5, 2013-2017 versus 2008-2012 death rates = 24.4 - 17.3 = 7.1 death rate
point increase in the recent 5 year period. Substance Death Rate =
(Substance deaths/population) x
100,000.
Calculation for Percent Change = ((New Value - Old Value)/ Old Value )*100 = 43.6% =
New York ((2013-2017 Substance deaths - 2008-2012 Substance deaths ) /
(2008-2012 Substance deaths ))*100 = ((24,124 - 16,794) / ( 16,794))*100
= ((7,330) / ( 16,794))*100 =
43.6%

North Carolina had significant a 37.6% substance death
increase - - -
- 3,822 more substance deaths in
the recent 5 year span versus prior 5 years, 2013-2017 versus 2008-2012 =
13,978 - 10,156 = 3,822 more substance deaths in the recent 5 year span.
North Carolina had 13,978 substance deaths in the recent 5 years, 2013-2017.
North Carolina substance death rate
increased significantly 6.5 points comparing recent 5 year substance death rate to
prior 5, 2013-2017 versus 2008-2012 death rates = 27.8 - 21.3 = 6.5 death rate
point increase in the recent 5 year period. Substance Death Rate =
(Substance deaths/population) x 100,000.
Calculation for Percent Change = ((New Value - Old Value)/ Old Value )*100 = 37.6% =
North Carolina ((2013-2017 Substance deaths - 2008-2012 Substance deaths ) /
(2008-2012 Substance deaths ))*100 = ((13,978 - 10,156) / ( 10,156))*100
= ((3,822) / ( 10,156))*100 =
37.6%

North Dakota had significant a 39.5% substance death
increase - - -
- 246 more substance deaths in
the recent 5 year span versus prior 5 years, 2013-2017 versus 2008-2012 = 869 -
623 = 246 more substance deaths in the recent 5 year span. North Dakota
had 869 substance deaths in the recent 5 years, 2013-2017.
North Dakota substance death rate
increased significantly 4.8 points comparing recent 5 year substance death rate to
prior 5, 2013-2017 versus 2008-2012 death rates = 23.3 - 18.4 = 4.8 death rate
point increase in the recent 5 year period. Substance Death Rate =
(Substance deaths/population) x 100,000.
Calculation for Percent Change = ((New Value - Old Value)/ Old Value )*100 = 39.5% =
North Dakota ((2013-2017 Substance deaths - 2008-2012 Substance deaths ) /
(2008-2012 Substance deaths ))*100 = ((869 - 623) / ( 623))*100 =
((246) / ( 623))*100 =
39.5%

Oklahoma had significant a 17.% substance death
increase - - -
- 1,014 more substance deaths in
the recent 5 year span versus prior 5 years, 2013-2017 versus 2008-2012 = 6,979
- 5,965 = 1,014 more substance deaths in the recent 5 year span. Oklahoma
had 6,979 substance deaths in the recent 5 years, 2013-2017.
Oklahoma substance death rate
increased significantly 4. points comparing recent 5 year substance death rate to
prior 5, 2013-2017 versus 2008-2012 death rates = 35.8 - 31.8 = 4. death rate
point increase in the recent 5 year period. Substance Death Rate =
(Substance deaths/population) x 100,000.
Calculation for Percent Change = ((New Value - Old Value)/ Old Value )*100 = 17.% =
Oklahoma ((2013-2017 Substance deaths - 2008-2012 Substance deaths ) /
(2008-2012 Substance deaths ))*100 = ((6,979 - 5,965) / ( 5,965))*100 =
((1,014) / ( 5,965))*100 = 17.%

Oregon had significant a 22.7% substance death increase - - - - 1,376 more substance deaths in the recent
5 year span versus prior 5 years, 2013-2017 versus 2008-2012 = 7,434 - 6,058 =
1,376 more substance deaths in the recent 5 year span. Oregon had 7,434
substance deaths in the recent 5 years, 2013-2017.
Oregon substance death rate
increased significantly 5.3 points comparing recent 5 year substance death rate to
prior 5, 2013-2017 versus 2008-2012 death rates = 36.9 - 31.6 = 5.3 death rate
point increase in the recent 5 year period. Substance Death Rate =
(Substance deaths/population) x 100,000.
Calculation for Percent Change = ((New Value - Old Value)/ Old Value )*100 = 22.7% = Oregon
((2013-2017 Substance deaths - 2008-2012 Substance deaths ) / (2008-2012
Substance deaths ))*100 = ((7,434 - 6,058) / ( 6,058))*100 =
((1,376) / ( 6,058))*100 =
22.7%

Pennsylvania had significant a 62.9% substance death
increase - - -
- 9,375 more substance deaths in
the recent 5 year span versus prior 5 years, 2013-2017 versus 2008-2012 =
24,278 - 14,903 = 9,375 more substance deaths in the recent 5 year span.
Pennsylvania had 24,278 substance deaths in the recent 5 years, 2013-2017.
Pennsylvania substance death rate
increased significantly 14.5 points comparing recent 5 year substance death rate to
prior 5, 2013-2017 versus 2008-2012 death rates = 38. - 23.5 = 14.5 death rate
point increase in the recent 5 year period. Substance Death Rate =
(Substance deaths/population) x
100,000.
Calculation for Percent Change = ((New Value - Old Value)/ Old Value )*100 = 62.9% =
Pennsylvania ((2013-2017 Substance deaths - 2008-2012 Substance deaths ) /
(2008-2012 Substance deaths ))*100 = ((24,278 - 14,903) / ( 14,903))*100
= ((9,375) / ( 14,903))*100 =
62.9%

Rhode Island had significant a 45.9% substance death
increase - - -
- 693 more substance deaths in
the recent 5 year span versus prior 5 years, 2013-2017 versus 2008-2012 = 2,203
- 1,510 = 693 more substance deaths in the recent 5 year span. Rhode
Island had 2,203 substance deaths in the recent 5 years, 2013-2017.
Rhode Island substance death rate
increased significantly 13. points comparing recent 5 year substance death rate to
prior 5, 2013-2017 versus 2008-2012 death rates = 41.7 - 28.7 = 13. death rate
point increase in the recent 5 year period. Substance Death Rate =
(Substance deaths/population) x
100,000.
Calculation for Percent Change = ((New Value - Old Value)/ Old Value )*100 = 45.9% =
Rhode Island ((2013-2017 Substance deaths - 2008-2012 Substance deaths ) /
(2008-2012 Substance deaths ))*100 = ((2,203 - 1,510) / ( 1,510))*100 =
((693) / ( 1,510))*100 =
45.9%

South Carolina had significant a 30.6% substance death
increase - - -
- 1,618 more substance deaths in
the recent 5 year span versus prior 5 years, 2013-2017 versus 2008-2012 = 6,897
- 5,279 = 1,618 more substance deaths in the recent 5 year span. South
Carolina had 6,897 substance deaths in the recent 5 years, 2013-2017.
South Carolina substance death rate
increased significantly 5.4 points comparing recent 5 year substance death rate to
prior 5, 2013-2017 versus 2008-2012 death rates = 28.2 - 22.8 = 5.4 death rate
point increase in the recent 5 year period. Substance Death Rate =
(Substance deaths/population) x
100,000.
Calculation for Percent Change = ((New Value - Old Value)/ Old Value )*100 = 30.6% =
South Carolina ((2013-2017 Substance deaths - 2008-2012 Substance deaths ) / (2008-2012
Substance deaths ))*100 = ((6,897 - 5,279) / ( 5,279))*100 =
((1,618) / ( 5,279))*100 =
30.6%

South Dakota had significant a 37.1% substance death
increase - - -
- 315 more substance deaths in
the recent 5 year span versus prior 5 years, 2013-2017 versus 2008-2012 = 1,163
- 848 = 315 more substance deaths in the recent 5 year span. South Dakota
had 1,163 substance deaths in the recent 5 years, 2013-2017.
South Dakota substance death rate
increased significantly 6.3 points comparing
recent 5 year substance death rate to prior 5, 2013-2017 versus 2008-2012
death rates = 27.1 - 20.8 = 6.3 death rate point increase in the recent 5 year
period. Substance Death Rate = (Substance deaths/population) x
100,000.
Calculation for Percent Change = ((New Value - Old Value)/ Old Value )*100 = 37.1% =
South Dakota ((2013-2017 Substance deaths - 2008-2012 Substance deaths ) /
(2008-2012 Substance deaths ))*100 = ((1,163 - 848) / ( 848))*100 =
((315) / ( 848))*100 = 37.1%

Tennessee had significant a 36.6% substance death
increase - - -
- 3,097 more substance deaths in
the recent 5 year span versus prior 5 years, 2013-2017 versus 2008-2012 =
11,562 - 8,465 = 3,097 more substance deaths in the recent 5 year span.
Tennessee had 11,562 substance deaths in the recent 5 years, 2013-2017.
Tennessee substance death rate
increased significantly 8.4 points comparing recent 5 year substance death rate to
prior 5, 2013-2017 versus 2008-2012 death rates = 35. - 26.7 = 8.4 death rate
point increase in the recent 5 year period. Substance Death Rate =
(Substance deaths/population) x
100,000.
Calculation for Percent Change = ((New Value - Old Value)/ Old Value )*100 = 36.6% =
Tennessee ((2013-2017 Substance deaths - 2008-2012 Substance deaths ) /
(2008-2012 Substance deaths ))*100 = ((11,562 - 8,465) / ( 8,465))*100 =
((3,097) / ( 8,465))*100 =
36.6%

Texas had significant a 21.7% substance death increase - - - - 4,525 more substance deaths in the recent
5 year span versus prior 5 years, 2013-2017 versus 2008-2012 = 25,353 - 20,828
= 4,525 more substance deaths in the recent 5 year span. Texas had 25,353
substance deaths in the recent 5 years, 2013-2017.
Texas substance death rate
increased 2. points comparing recent 5 year substance death rate to
prior 5, 2013-2017 versus 2008-2012 death rates = 18.5 - 16.5 = 2. death rate
point increase in the recent 5 year period. Substance Death Rate = (Substance
deaths/population) x
100,000.
Calculation for Percent Change = ((New Value - Old Value)/ Old Value )*100 = 21.7% =
Texas ((2013-2017 Substance deaths - 2008-2012 Substance deaths ) / (2008-2012
Substance deaths ))*100 = ((25,353 - 20,828) / ( 20,828))*100 =
((4,525) / ( 20,828))*100 =
21.7%

Utah had significant a 29.9% substance death increase - - - - 1,086 more substance deaths in the recent
5 year span versus prior 5 years, 2013-2017 versus 2008-2012 = 4,717 - 3,631 =
1,086 more substance deaths in the recent 5 year span. Utah had 4,717
substance deaths in the recent 5 years, 2013-2017.
Utah substance death rate increased
significantly 5.2 points comparing recent 5 year substance death rate to
prior 5, 2013-2017 versus 2008-2012 death rates = 31.5 - 26.3 = 5.2 death rate
point increase in the recent 5 year period. Substance Death Rate =
(Substance deaths/population) x 100,000.
Calculation for Percent Change = ((New Value - Old Value)/ Old Value )*100 = 29.9% =
Utah ((2013-2017 Substance deaths - 2008-2012 Substance deaths ) / (2008-2012
Substance deaths ))*100 = ((4,717 - 3,631) / ( 3,631))*100 =
((1,086) / ( 3,631))*100 =
29.9%

Vermont had significant a 50.4% substance death
increase - - -
- 366 more substance deaths in
the recent 5 year span versus prior 5 years, 2013-2017 versus 2008-2012 = 1,092
- 726 = 366 more substance deaths in the recent 5 year span. Vermont had
1,092 substance deaths in the recent 5 years, 2013-2017.
Vermont substance death rate
increased significantly 11.7 points comparing recent 5 year substance death rate to
prior 5, 2013-2017 versus 2008-2012 death rates = 34.9 - 23.2 = 11.7 death rate
point increase in the recent 5 year period. Substance Death Rate =
(Substance deaths/population) x
100,000.
Calculation for Percent Change = ((New Value - Old Value)/ Old Value )*100 = 50.4% =
Vermont ((2013-2017 Substance deaths - 2008-2012 Substance deaths ) /
(2008-2012 Substance deaths ))*100 = ((1,092 - 726) / ( 726))*100 =
((366) / ( 726))*100 =
50.4%

Virginia had significant a 51.6% substance death increase - - - - 3,176 more substance deaths in the recent
5 year span versus prior 5 years, 2013-2017 versus 2008-2012 = 9,336 - 6,160 =
3,176 more substance deaths in the recent 5 year span. Virginia had 9,336
substance deaths in the recent 5 years, 2013-2017.
Virginia substance death rate
increased significantly 6.9 points comparing recent 5 year substance death rate to
prior 5, 2013-2017 versus 2008-2012 death rates = 22.3 - 15.4 = 6.9 death rate
point increase in the recent 5 year period. Substance Death Rate = (Substance
deaths/population) x 100,000.
Calculation for Percent Change = ((New Value - Old Value)/ Old Value )*100 = 51.6% =
Virginia ((2013-2017 Substance
deaths - 2008-2012 Substance deaths ) / (2008-2012 Substance deaths
))*100 = ((9,336 - 6,160) / ( 6,160))*100 = ((3,176) / (
6,160))*100 =
51.6%

Washington had significant a 18.7% substance death increase - - -
- 1,825 more substance deaths in
the recent 5 year span versus prior 5 years, 2013-2017 versus 2008-2012 =
11,595 - 9,770 = 1,825 more substance deaths in the recent 5 year span.
Washington had 11,595 substance deaths in the recent 5 years, 2013-2017.
Washington substance death rate
increased significantly 3.3 points comparing recent 5 year substance death rate to prior
5, 2013-2017 versus 2008-2012 death rates = 32.3 - 29. = 3.3 death rate point
increase in the recent 5 year period. Substance Death Rate = (Substance
deaths/population) x
100,000.
Calculation for Percent Change = ((New Value - Old Value)/ Old Value )*100 = 18.7% =
Washington ((2013-2017 Substance deaths - 2008-2012 Substance deaths ) /
(2008-2012 Substance deaths ))*100 = ((11,595 - 9,770) / ( 9,770))*100 =
((1,825) / ( 9,770))*100 =
18.7%

West Virginia had significant a 54.1% substance death
increase - - -
- 1,788 more substance deaths in
the recent 5 year span versus prior 5 years, 2013-2017 versus 2008-2012 = 5,095
- 3,307 = 1,788 more substance deaths in the recent 5 year span. West
Virginia had 5,095 substance deaths in the recent 5 years, 2013-2017.
West Virginia substance death rate
increased significantly 19.7 points comparing recent 5 year substance death rate to
prior 5, 2013-2017 versus 2008-2012 death rates = 55.4 - 35.7 = 19.7 death rate
point increase in the recent 5 year period. Substance Death Rate =
(Substance deaths/population) x
100,000.
Calculation for Percent Change = ((New Value - Old Value)/ Old Value )*100 = 54.1% =
West Virginia ((2013-2017 Substance deaths - 2008-2012 Substance deaths ) /
(2008-2012 Substance deaths ))*100 = ((5,095 - 3,307) / ( 3,307))*100 =
((1,788) / ( 3,307))*100 =
54.1%

Wisconsin had significant a 42.2% substance death
increase - - -
- 2,561 more substance deaths in
the recent 5 year span versus prior 5 years, 2013-2017 versus 2008-2012 = 8,636
- 6,075 = 2,561 more substance deaths in the recent 5 year span.
Wisconsin had 8,636 substance deaths in the recent 5 years, 2013-2017.
Wisconsin substance death rate increased
significantly 8.6 points comparing recent 5 year substance death rate to
prior 5, 2013-2017 versus 2008-2012 death rates = 29.9 - 21.4 = 8.6 death rate
point increase in the recent 5 year period. Substance Death Rate =
(Substance deaths/population) x
100,000.
Calculation for Percent Change = ((New Value - Old Value)/ Old Value )*100 = 42.2% =
Wisconsin ((2013-2017 Substance deaths - 2008-2012 Substance deaths ) /
(2008-2012 Substance deaths ))*100 = ((8,636 - 6,075) / ( 6,075))*100 =
((2,561) / ( 6,075))*100 =
42.2%

Wyoming had significant a 31.1% substance death
increase - - -
- 277 more substance deaths in
the recent 5 year span versus prior 5 years, 2013-2017 versus 2008-2012 = 1,169
- 892 = 277 more substance deaths in the recent 5 year span. Wyoming had
1,169 substance deaths in the recent 5 years, 2013-2017.
Wyoming substance death rate
increased significantly 8.4 points comparing recent 5 year substance death rate to
prior 5, 2013-2017 versus 2008-2012 death rates = 40.1 - 31.7 = 8.4 death rate point
increase in the recent 5 year period. Substance Death Rate = (Substance
deaths/population) x
100,000.
Calculation for Percent
Change =
((New Value - Old Value)/ Old Value )*100 =
31.1% = Wyoming ((2013-2017 Substance deaths - 2008-2012 Substance
deaths ) / (2008-2012 Substance deaths ))*100
= ((1,169 - 892) / ( 892))*100 = ((277)
/ ( 892))*100 = 31.1%

This report includes all mind-altering substance deaths, not just opiates. It includes opiates, narcotics, marijuana/cannabinoids, vaping, alcohol, meth, methamphetamine, sedatives, benzodiazepines, tranquilizers, xanax, stimulants, cocaine, hallucinogens, tobacco and other mind-altering substances are included in this report, see Substance Death ICD List below.
When a person is suffering from a physical addiction “unrecovered" (without protected recovery and support), a person sometimes reaches for another mind-altering substance to deal with hard withdraw, as such, addiction increases. Substances have increased in variety and poisonous strength.
When mind altering substances increase in an area - accidents, suicides, homelessness and sicknesses increase due to the high/drunk deceiving effect a mind-altering substance has on a person.
--------------------------
Cap It
Without limits, a mind altering substance becomes an accidental abuse. Blue Cross Blue Shield of Michigan announced in 2018 it will cap, limit its members' opioid prescriptions to 30 days, and in some cases, five days in efforts to address the opioid epidemic in both its state and the nation. Limits protect health, prevent over-prescribing and help decrease addiction and accidental deaths, https://www.thefix.com/
**************************
Over-prescribing:
Over prescribing a mind-altering substance, historically does not do well for young people in the area. Limits should be placed on ALL mind altering substances to prevent them from reaching a crowd of people for which they were not intended, young people. Over-prescribing a mind-altering substance has a history of making it's way to people not intended, such as young people, with devastating results. Over-prescribing does not do well for young people in the area, young crude deaths tend to increase in areas where lax mind-altering substance laws are instituted.
For example, in West Virginia between 2006 and 2016, drug distributors shipped large quantities of opiate hydrocodone and oxycodone to two pharmacies in Williamson at the same time a doctor overprescribed. As such, West Virginia Age 15-34 year old crude death rate increased to 139.3 is 48.6 points higher than US death rate 90.7 during the same year period 2012-2016.
See link to view West Virginia article. https://www.wvgazettemail.com/news/health/drug-firms-shipped-m-pain-pills-to-wv-town-with/article_ef04190c-1763-5a0c-a77a-7da0ff06455b.html
************************************************************************************
Recreational marijuana is a type of over-prescribing. Over-prescribing a mind-altering substance has a history of making it's way to people not intended, such as young people, with devastating results. Over-prescribing does not do well for young people in the area, young crude deaths tend to increase in areas where lax mind-altering substance laws are instituted.
(1). removes a doctor prescription so adults over 21 years old can use any time for any reason and
(2). For example, in the Michigan ballot which went through in 2018, which proposed legalizing 10 ounces of marijuana, which equates to 567 marijuana joints, an 18 month daily supply of 0.5 gram size marijuana, a year and a half supply of marijuana allowed in homes in Michigan where people are over 21 years of age – heavy over-prescribing!
Mind-altering substances should have no more than a 2-4 week supply, see Cap It above. (a). 2.5 ounces (141 joints can be sitting in the house out in the open) a 4.5 month supply of marijuana can be sitting out in the open in any home a child could enter in Michigan --- which is NOT safe for young people who live in the area!!
--------------------------
For example, Colorado, a recreation marijuana state, had a 27% increase in young crude deaths for ages 25-34 years old comparing the five year span 2012-2016 to the five years prior 2007-2011, 901 more crude deaths in the five year span following recreational marijuana implementation versus the five years prior, 2012-2016 vs 2007-2011 = 4,232 - 3,331 = 901 more crude deaths in the five year span 2012-2016. Colorado had 4,232 age 25-34 year old crude deaths in the 5 year period, 2012-2016. After recreational marijuana was implemented, Colorado age 25-34 year old crude death rate increased significantly 12.4 points comparing 2012-2016 vs 2007-2011 death rates = 105.6 - 93.2 = 12.4 death rate point increase.
--------------------------
Teens Marijuana Use:
How do we know marijuana is making its way to the hands of teens, a sad note by NIDA, December 2017, states "daily marijuana use exceeds daily cigarette use among 8th (0.8 vs. 0.6 percent), 10th (2.9 vs. 2.2 percent) and 12th (5.9 vs. 4.2 percent) graders. DAILY MARIJUANA USE is physical addiction in young people, so very sad the struggles these teens are facing due to lax laws that removed strong barriers to prevent substances from reaching young people. Daily marijuana use is
1 in 7 teens report using marijuana in the past month indicates NIDA (National Institute on Drug Abuse); National Institutes of Health; U.S. Department of Health and Human Services web site 9-28-19 , https://teens.drugabuse.gov/drug-facts/marijuana
-
Marijuana has a strong potential for abuse and is classified as a schedule Ι drug.
--------------------------
Marijuana THC Potency Increased (THC is the addictive part that gets a person high) The potency of an average marijuana cigarette has steadily increased from 3 percent THC in the early 1990's to 12.5 percent THC in 2013. NIDA (National Institute on Drug Abuse); National Institutes of Health; U.S. Department of Health and Human Services web site 9-28-19, https://www.drugabuse.gov/
**************************
According to NIDA, marijuana concentrates can have, 50-80% THC, High potential for Addiction! https://www.drugabuse.gov/
**************************
How much more potent is marijuana today?
Marijuana Potency.... between 1990 and 2014, THC in marijuana, in some cases, increased 2,288%!!!! .....see below to see how THC increase is calculated
How do we calculate potency?
According to NIDA, in 1990 a standard Marijuana joint was roughly 3% THC.
NIDA (National Institute on Drug Abuse) (June 20, 2014) Mixed Signals: The Administration’s Policy on Marijuana, Part Four -- Scientific Focus on the Adverse Health Effects of Marijuana Use
https://archives.drugabuse.gov/testimonies/2014/mixed-signals-administrations-policy-marijuana-part-four-scientific-focus-adverse-health-effects
A standard marijuana cigarette-joint size is 0.5 grams.
We multiply the THC percent 3% by 0.5 grams (standard joint size) = .03x0.5=0.015 grams THC per 0.5 gram joint.
[Based on this information, the standard Marijuana joint size set in the 1990s is 0.015 grams grams of 100% THC.] Back in the 1990's, a standard marijuana joint was 0.015 grams of 100% THC, the addictive part of marijuana.
According to NIDA average Marijuana THC increased to 12.5% percent THC in 2013 = .125 THC x 0.5 grams (joint size) = 0.0625 grams of 100% THC, which is a 317% increase in THC between 1990 and 2013!!!! This is what made it's way to teens.
The percent change calculation = (new value— old value) / old value = ((0.0625-0.015) / 0.015) x100 = ((0.0475) / 0.015) x100 = 317% increase in THC between 1990 and 2013 (THC is the addictive part that gets a person high). THC potency addiction increased 317% between 1990 and 2013.
According to NIDA Marijuana Oils and Extracts can be as as high as 80% THC = .80 THC x 0.5 grams (joint size) = .4 grams of 100% THC is a 2,567% increase in THC between 1990 and 2013! A 2,567% THC increase is equivalent to smoking 26.6 1990 joints in one 0.5 gram joint, in one setting! This is what teens confront today, that is potent!! Trying to get off the stuff, teens sometimes reach for another worse substance. Marijuana wasn’t good to teens that smoked joints in the 1990’s, the grams of THC increased 2,567% from 1990 to 2013 — way more POTENT, addictive today!!!! However the good news, with encouragement, many are realizing it is horrible to be addicted, receive help, go on to lead good lives.
The percent change calculation = (new value— old value) / old value = ((0.4-0.015) / 0.015) x100 = 2,567% THC potency addiction increased as much as 2,567% in a 80% THC marijuana extract or oil between 1990 and 2013.
NIDA also noted a rapid rise in emergency room (ER) admissions linked to marijuana use attests to the greater dangers of acute use. There were 128,857 ER visits related to marijuana use in 2011, nearly double the number from 2004 (65,699). Thus, Emergency room visits related to marijuana increased 96%, 2011 compared to 2004=((128,857-656,99)/656,99)x100 = 96%!!!
The number of Marijuana public treatment admissions in Michigan attests to the higher marijuana potency, see page 15 of this report. This report also indicates very potent addictive substances are in Michigan in which residents are suffering (alcohol, heroin, opiates, cocaine, marijuana, methamphetamine, etc.). As such, we should do everything possible to uphold safe laws for residents and implement extra measures during this critical period to be sure we are supporting our most vulnerable residents, lax laws recklessly endanger vulnerable citizens. https://www.michigan.gov/documents/msp/FY18_Meth_Related_Criminal_Incidents_651356_7.pdf
The 2008 Michigan marijuana law voted in allowed a physician to prescribe medical marijuana to a patient giving the patient the ability to carry and possess marijuana up to 2.5 ounces of medical marijuana. http://norml.org/legal/item/michigan-medical-marijuana In 2008, the 2.5 ounces of marijuana should never have been brought to voters written in such a way that it left out important details indicating this is heavily over-prescribing a mind-altering substance and the ramifications of increase in young deaths to citizens in areas where it is implemented. Boulder County, is the first county in Colorado to implement recreational marijuana, experienced horrible tragic young death increase.
One standard average marijuana joint-cigarette = is 0.5 grams
1 ounce equals 28.3495231 Grams
28.3495231 Grams x (1 joint/ 0.5 grams) = 56.6990462 joints
1 ounce equals 56.699 0462 joint cigarettes (0.5 grams)
2.5 ounces x 28.3495231 = 70.87380775 grams (1 joint/0.5 grams) = 141 joints
Medicinal Marijuana heavy over-prescribing in Michigan #####################
Before the 2008 marijuana bill was brought to Michigan voters, it should have been clarified to voters it included heavy over-prescribing, and the ramifications this presents to an area.
Over prescribing a mind-altering substance, historically does not do well for young people in the area. Over-prescribing does not do well for young people in the area, young crude deaths tend to increase in areas where lax mind-altering substance laws are instituted. When mind altering substances increase in an area - accidents, suicides, homelessness and sicknesses increase due to the high/drunk deceiving effect a mind-altering substance has on a person.
A 2-4 week limit should be placed on ALL mind altering substances to prevent them from reaching a crowd of people for which they were not intended, young people. Instead of limits, heavy over-prescribing occurred in 2008. Over-prescribing a mind-altering substance has a history of making it's way to people not intended, such as young people, with devastating results. Additionally no limits were placed on potency, which in some cases increased 2,567%.
Instead of a limit, Michigan medical marijuana made a way for people to drive around with a lot of weed - 141 medical marijuana joints of a 0.5 gram size, a 4.5 month supply of medical marijuana which is 2.5 ounces of marijuana. The 2008 MI medicinal marijuana allowed a physician to prescribe a patient 2.5 ounces of marijuana, which equals 141 medical marijuana joints of a 0.5 gram size, a 4.5 month supply of medical marijuana, way over-prescribing. The bill just said a physican can prescribe 2.5 ounces of marijuana, the public doesn't smoke pot, doesn't realize this a 4.5 month supply of weed. This assumes a patient smokes 0.5 grams of marijuana a day, which is a lot. As such, marijuana over-flow has been building up in Michigan since 2008, which coincides with death increases. We were built to serve God, we were not built to serve the misery bondage of mind-altering substances. Getting off them is hard, it deceives the mind of the person using, thus it is really important to limit its' use.
Limits should be placed on all mind altering substances to prevent them from reaching a crowd of people for which they were not intended. Giving the ability to prescribe a 4.5 month supply of medical marijuana (2.5 ounces) to a patient, is heavy over prescribing a mind-altering substance, which historically does not do well for young people in the area, young crude deaths tend to increase in areas where lax mind-altering substance laws are instituted, see Monroe Michigan.
Some states allow twice the medicinal amount of Michigan (Delaware and New Mexico), medical marijuana laws in these states allow a patient to carry and possess 6 ounces (340 joins of .5 gram size), almost a year supply of medical marijuana, super heavy over prescribing!!!! With those amounts, young people in those states struggle way more than young people in Michigan. 2013-2017, New Mexico had the 2nd highest crude death rate for ages 25-34 years old and Delaware had the 16th highest state death rate for ages 25-34 years old. https://hisgracematterscommunitynumbersmatter.blogspot.com/p/42_49.html
Without limits, a substance becomes an abuse in which people in the area are hurt. Young people are more vulnerable to addiction, that is why alcohol has a higher age limit, the younger a person starts, the more likely addiction spirals out of control. Lids must be implemented to prevent weed and tobacco from reaching teens, it is not intended for them. Someone drinking a bottle of vodka is really struggling, just as someone using heroin or fentanyl is really struggling. If physician or patient sees THC amount is going up by looking at history, it means his patient is getting addicted, thus should engage the patient in counseling to prevent a serious addiction. If the patient is seeking marijuana to deal with a serious opiate or alcohol addiction, then a temporary different THC % and plan for recovery support might be needed. A recovery plan with a sober godly focus must be put in place to prevent a more serious addiction in the wake of deadly substances which many people accidentally overdose, see resources below.
It is our responsibility as parents, citizens and leaders to protect people, especially young and vulnerable people, with sober-minded safe laws that prevent over-prescribing and prevent marketing harmful mind-altering substances.
-------------------------------------------------------------------------------------------------------------------------------------
The founder of Bryan's Hope, Jeannie Richards, indicated reporting was needed to understand the magnitude of the substance problem, to prevent the next generation of children from stepping into the horrible substance situation.
In this day teens and adults are confronted with a variety of critically addictive and poisonous substances while at the same time receive mixed messages from television, cable, internet, radio, songs and books about people using mind-altering substances without noting any real harm, which is wrong and deceiving!
Source:
Centers for Disease Control and Prevention, National Center for Health Statistics. Dataset: Underlying Cause of Death. 1999-2017 on CDC WONDER Online Database, released December, 2018. Data from the Multiple Cause of Death Files, 1999-2017, as compiled from data provided by the 57 vital statistics jurisdictions through the Vital Statistics Cooperative Program. CDC source data, but not a CDC publication. Data Accessed at http://wonder.cdc.gov/
Substance ICD List
The substance ICD list for this report is listed below. ICD (International Statistical Classification of Diseases and Related Health Problems) 10th Revision, World Health Organization, 2010.
http://apps.who.int/classifications/icd10/browse/2010/en
Substance Death ICD List
ICD Description and Code
Alcohol: Mental and behavioural disorders due to use of alcohol, (ICD F10)
Opioids: Mental and behavioural disorders due to use of opioids, (ICD F11)
Cannabinoids: Mental and behavioural disorders due to use of cannabinoids, (ICD F12)
Sedatives Or Hypnotics: Mental/behavioural disorders due to use of sedatives or hypnotics, (ICD F13)
Cocaine: Mental and behavioural disorders due to use of cocaine, (ICD F14)
Stimulants: Mental and behavioural disorders due to use of other stimulants, (ICD F15)
Hallucinogens: Mental and behavioural disorders due to use of hallucinogens, (ICD F16)
Tobacco: Mental and behavioural disorders due to use of tobacco, (ICD F17)
Psychoactive: Mental & behavioural disorders due to multiple drug use & use of other psychoactive substances, (ICD F19)
Degeneration of nervous system due to alcohol, (ICD G31.2)
Alcoholic polyneuropathy, (ICD G62.1) Polyneuropathy due to other toxic agents, (ICD G62.2)
Alcoholic myopathy, (ICD G72.1)
Myopathy due to other toxic agents, (ICD G72.2)
Alcoholic cardiomyopathy, (ICD I42.6)
Cardiomyopathy due to drugs and other external agents, (ICD I42.7)
Respiratory conditions due to chemicals, gases, fumes and vapours (ICD J68)
Respiratory conditions due to unspecified external agent, (ICD J70.9)
Alcoholic gastritis, (ICD K29.2)
Alcoholic liver disease, (ICD K70)
Alcohol-induced acute pancreatitis, (ICD K85.2)
Alcohol-induced chronic pancreatitis, (ICD K86.0)
Newborn affected by maternal use of tobacco (ICD P04.2)
Newborn affected by maternal use of alcohol, (ICD P04.3)
Newborn affected by maternal use of drugs of addiction, (ICD P04.4)
Fetal alcohol syndrome (dysmorphic), (ICD Q86.0)
Finding of alcohol in blood, (ICD R78.0)
Contact with steam and hot vapours, (ICD X13)
Poisoning: nonopioid analgesics, antipyretics and antirheumatics (ICD X60 X40 Y10)
Poisoning: antiepileptic, sedative-hypnotic, antiparkinsonism & psychotropic drugs, not elsewhere classified (ICD X61 X41 Y11)
Poisoning: narcotics & psychodysleptics [hallucinogens], not elsewhere classified (ICD X62 X42 Y12)
Poisoning: other drugs acting on the autonomic nervous system (ICD X63 X43 Y13)
Poisoning: other and unspecified drugs, medicaments and biological substances (ICD X64 X44 Y14)
Poisoning: alcohol (ICD X65 X45 Y15)
Poisoning: organic solvents and halogenated hydrocarbons and their vapours (ICD X66 X46 Y16)
Poisoning: other gases and vapours (ICD X67 X47 Y17)
Poisoning: pesticides (ICD X68 X48 Y18)
Poisoning: other and unspecified chemicals and noxious substances (ICD X69 X49 Y19)
Assault by drugs, medicaments and biological substances, (ICD X85)
Assault by gases and vapours, (ICD X88)
Assault by steam, hot vapours and hot objects, (ICD X98)
Contact with steam, hot vapours and hot objects, undetermined intent, (ICD Y27)
Opioids and related analgesics, (ICD Y45.0)
Hydantoin derivatives, (ICD Y46.2)
Sedatives, hypnotics & antianxiety drugs [Barbiturates, Benzodiazepines, Cloral derivatives, etc.] (ICD Y47)
Anaesthetics and therapeutic gases (ICD Y48)
Psychotropic drugs, not elsewhere classified (ICD Y49)
Drug or medicament, unspecified, (ICD Y57.9)
Copyright information
Permission is given to print and share this report to support education and health of people, free of charge. When you share or print, suggested citation includes source, facebook page and blog.
Resources – Seeking Help
Medical Emergency Call 911
National Suicide Prevention Lifeline http://www.suicidepreventionlifeline.org
National Suicide Prevention Lifeline 1-800-273-8255
National Suicide Prevention Lifeline for Deaf; hard of hearing 1-800-799-4889
Intervene, help your child to recovery, signs of drug use https://drugfree.org/article/spotting-drug-use/
Treatment Locator – National listing by SAMHSA call 1-877-250-4665 (Mon-Fri 9-5 ET) or go to https://findtreatment.samhsa.gov/locator
Prepare to Take Action if You Suspect Teen or Young Adult Drug Use https://drugfree.org/article/prepare-to-take-action/
Signs of Opiod Use and getting Help (Understanding the Opioid Epidemic & What You Can Do) https://drugfree.org/article/get-help-for-a-loved-one/
How to Use Narcan/Naloxone https://drugfree.org/article/overdose-response-treatment/
6 Things to Do Before Your Child comes Home from Addiction Treatment https://drugfree.org/parent-blog/steps-to-take-before-son-or-daughter-returns-from-addiction-treatment/
24 Hour Toll Free Prayer Lines
Daystar 1-800-329-0029
Catholic prayer hotline TBD
National Prayer Center Assemblies of God 1-800-477-2937
Christian Broadcasting Network (700 Club) 1-800-759-0700
Common Ground: (248) 456-8144 to ask questions, go to treatment or detox (coming off a mind-altering substance is hard, it can temporarily make a person feel suicidal, which is why protected recovery detox is important, to have support during withdraw and to build recovery support. Some people have a hard time sleeping during early recovery, this is another reason for addiction treatment, so a person doesn't have to be responsible for work during withdraw. Some mind-altering substances require tapering off slowly with medical support for safe detoxification withdraw to reduce risk of harm (e.g., seizures, hallucinations, etc.) these are alcohol, opiates, benzodiazepines, methamphetamine, oxycontin, methadone or suboxone).
Veteran’s and their Families. http://www.veteranscrisisline.net/Resources/SpreadTheWord.aspx
Veteran’s and their Families Call: 1-800-273-8255
Greatest Commandment: Matthew 22:35-40
35 Then one of them, which was a lawyer, asked him a question, tempting him, and saying, 36 Master, which is the great commandment in the law? 37 Jesus said unto him, Thou shalt love the Lord thy God with all thy heart, and with all thy soul, and with all thy mind. 38 This is the first and great commandment. 39 And the second is like unto it, Thou shalt love thy neighbor as thyself. 40 On these two commandments hang all the law and the prophets.
Young people are a blessing and are made to live. Losing young people in the land in which we live is devastating, we must never forget those we lost and move forward with an intention to save, speak the truth about situations facing the young population.
Poisonous substances are in the news daily are being directed into every state, see seized news articles. Young people are vulnerable, when substances come into town, deaths increase, suicides increase, violence increases, misery increases.
When young deaths rise, a critical situation is occurring, Parents indicated reporting was needed to support young people in communities in the United States, they were right, this report revealed people of all ages are vulnerable to mind-altering substances, and young adults ages 25-34 years old in the U.S. experienced highest horrible significant 64.7% mind-altering substance death increase in the recent five years - - - - 29,610 more substance deaths in the recent five year span versus prior five years, 2013-2017 vs 2008-2012. This report was created to support residents in locating critical populations to work on solutions and give support. Living in Grace created this report to improve the health and well-being of persons living in the United States.
Mind-altering substance deaths happen in every age group. We lost infants, children, teens, young adults, brothers, sisters, aunts, uncles, mom's, dad's, adults, grandparents - sudden tragedy and heart-break effects family if recovery is not embraced by all family members.
When young deaths rise, a critical situation is occurring, we must determine to support life, support sober-minded: tell the truth about the deceiving nature of mind-altering substances, help young and old people to recovery, support churches, recovery centers, prisons and support sober-minded laws and sobriety education in schools.
The first step to changing the situation is to admit addiction exists, mind-altering substances can cause misery and tragic early death if addiction sets in without recovery support. The good news is we have a God who saves, see Deuteronomy 6 below.
Understanding death increase enables residents to locate critical populations to work on sober-minded solutions and give support. Living in Grace created these reports to improve the health and well-being of persons living in the United States. Recovery and sobriety works. Working together with governments, schools, places of worship, community groups, universities, colleges, hospitals, police, fire departments, EMS and businesses to help those suffering to recovery, support those in prison to prevent the next generation of children from stepping into the horrible substance situation.
Contact:
Phone: Please join us in supporting good health of all people call 248-392-8676 or email hismatter@gmail.com or join us at
Crude Death Reports https://hisgracematters.blogspot.com/
Crude Death Reports https://hiskingdomnumbersmatter.blogspot.com
Living in Grace Page https://www.facebook.com/livinginGracematters/
Donations (click facebook blue donate button): https://www.facebook.com/livinginGracematters/
Living in Grace Page https://www.facebook.com/livinginGracematters/
Donations (click facebook blue donate button): https://www.facebook.com/livinginGracematters/